How to access your own energy consumption info for free.
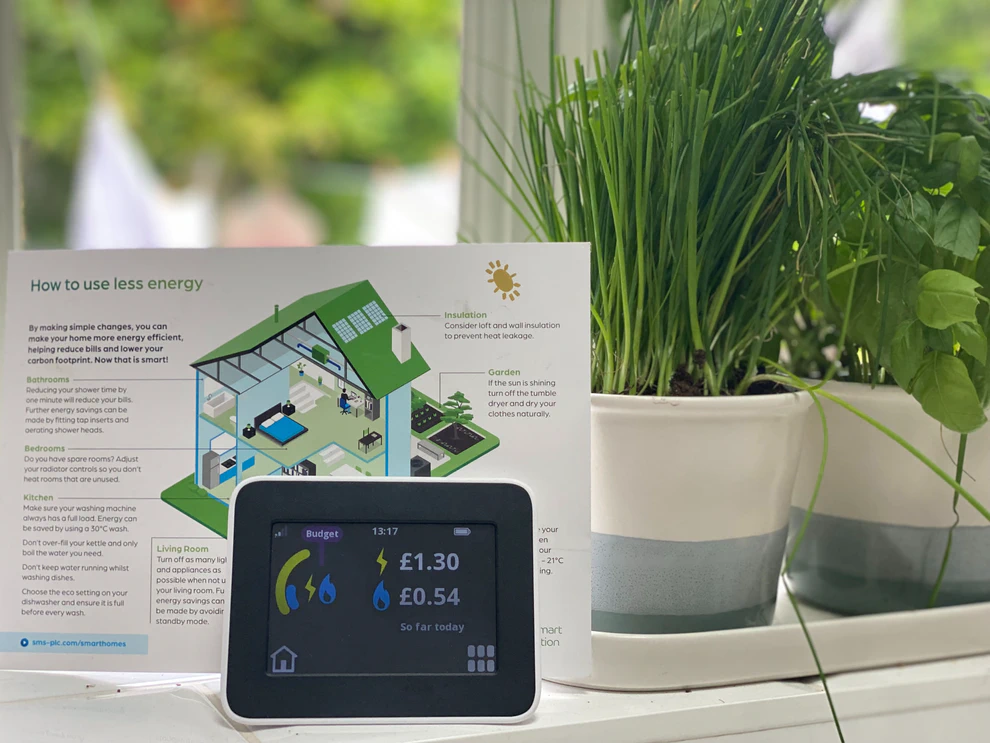
About 50% of UK homes have installed smart energy meters. The picture is a bit complicated as the Smart Metering Equipment Technical Specifications (SMETS) had a rocky start. The UK started rolling out the SMETS 1 standard in 2011 only to discover some significant issues with interoperability - basically needing a new meter if you changes supplier! Nowadays, if you ask for a meter to be installed it will be a SMETS2 version, which is good for consumers and will help us build a picture of our energy use in real time. It is very likely that your energy supplier will offer to install an In-Home-Display (IHD):
These are a basic way for you to “see” what’s happening on your meter. Usually offering you either a usage or cost based view of your energy consumption on a today/week/month basis. A little “fear” meter that doesn’t offer anything useful (like data export or vs standard comparison).
Luckily, the SMETS2 specification includes the ability for consumers to connect third-party energy management and monitoring services. It is this capability that we can leverage to get a picture of our own usage.
Once you have a smart meter, you need to headover to https://glowmarkt.com/bright and download the Bright app. When you sign up this gives the app’s parent Hidebrand access to you meter data and immediately lets them put the IHD data on your phone. With an account you also now have access to their web api which will let you access your own data in the cloud.
What follows is some investigation we undertook using home assistant to try and figure out the data data accuracy from hildebrand’s 3 different sources.
TLDR: it’s close enough that it doesn’t matter for most people.
Hidebrand offer 3 different ways to access you meter data:
- Through their app.
- Through their web api.
- Directly from a Consumer Access Device (CAD) in your home.
Since I have all three, I wanted to know how accurate each one is for the purposes of tracking your actual energy usage at home.
So I took a random Sunday and compared in the data:
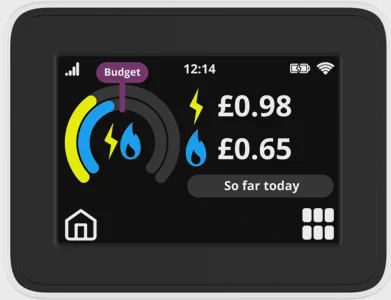
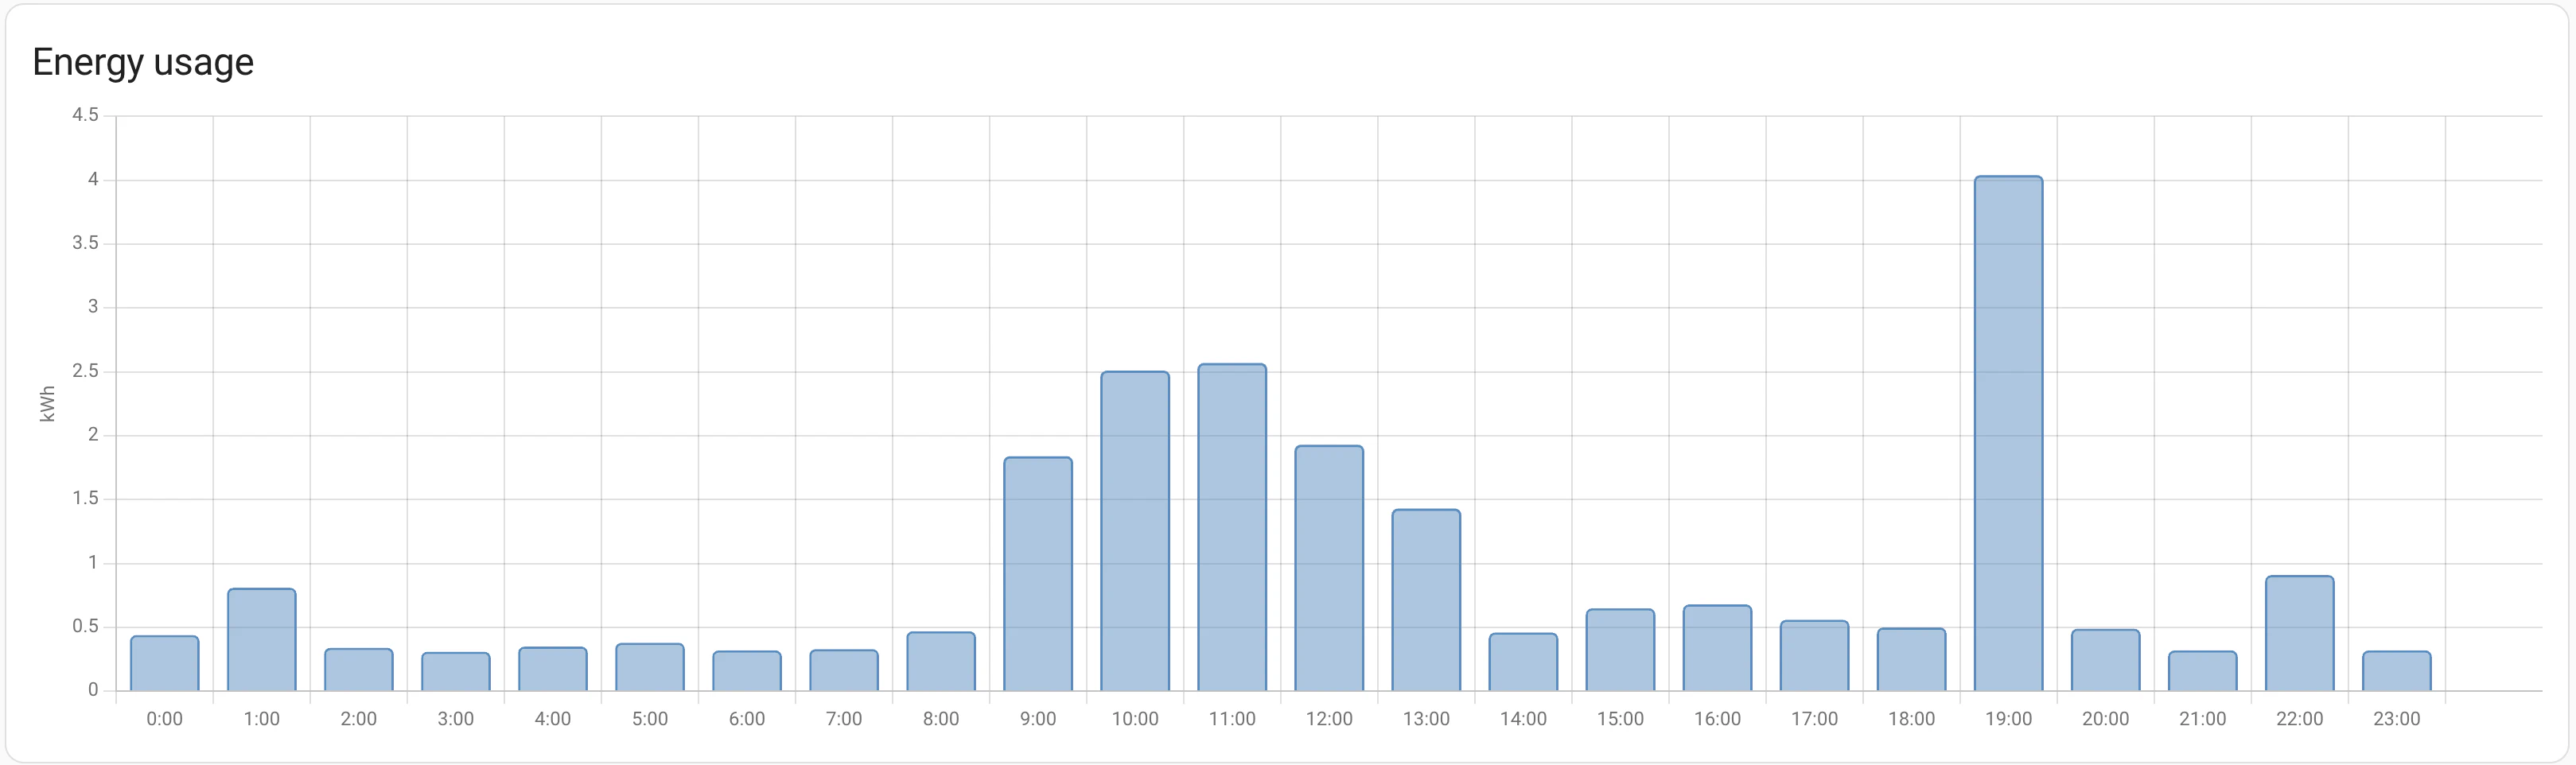
Data from the app:
The usage looks similar to the locally souced data from the CAD and the app also provides the hourly energy in either kWh or £ cost.
From the local CAD device:
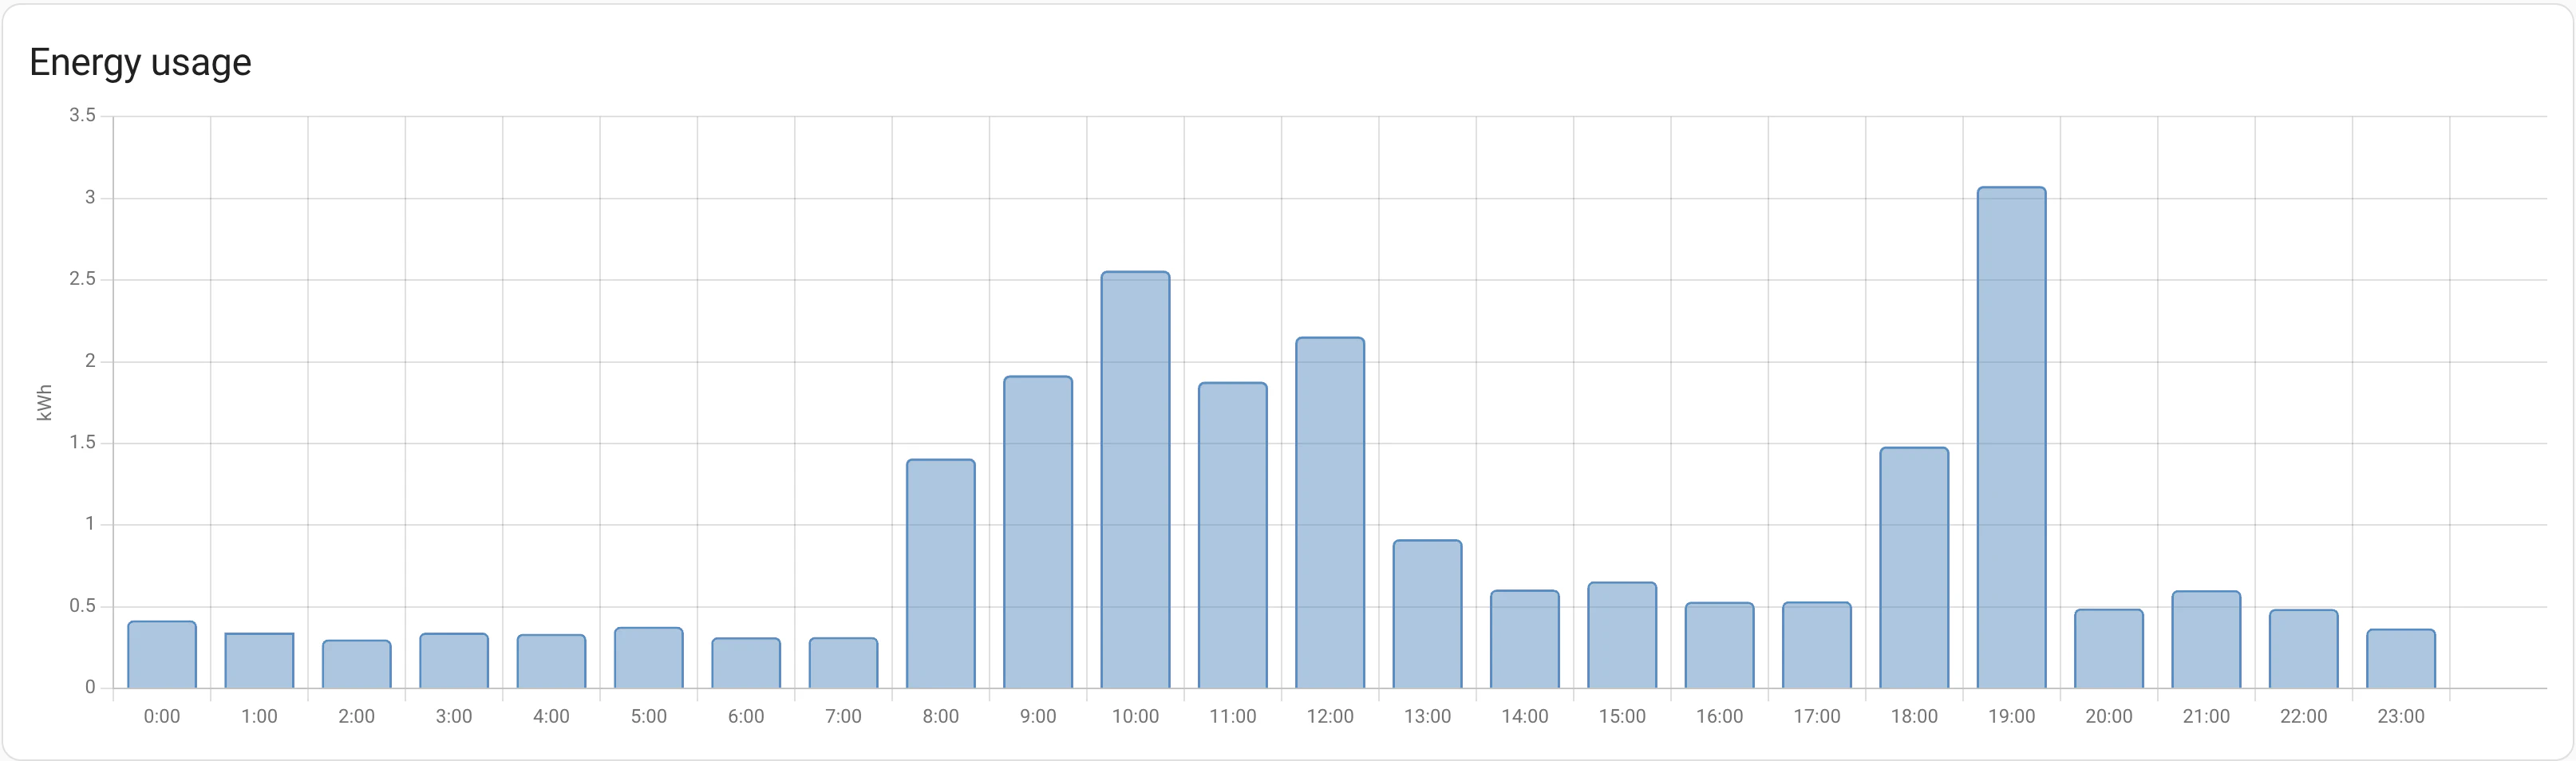 Using the CAD to output the data to home assistant it matches closely the reported usage in the app.
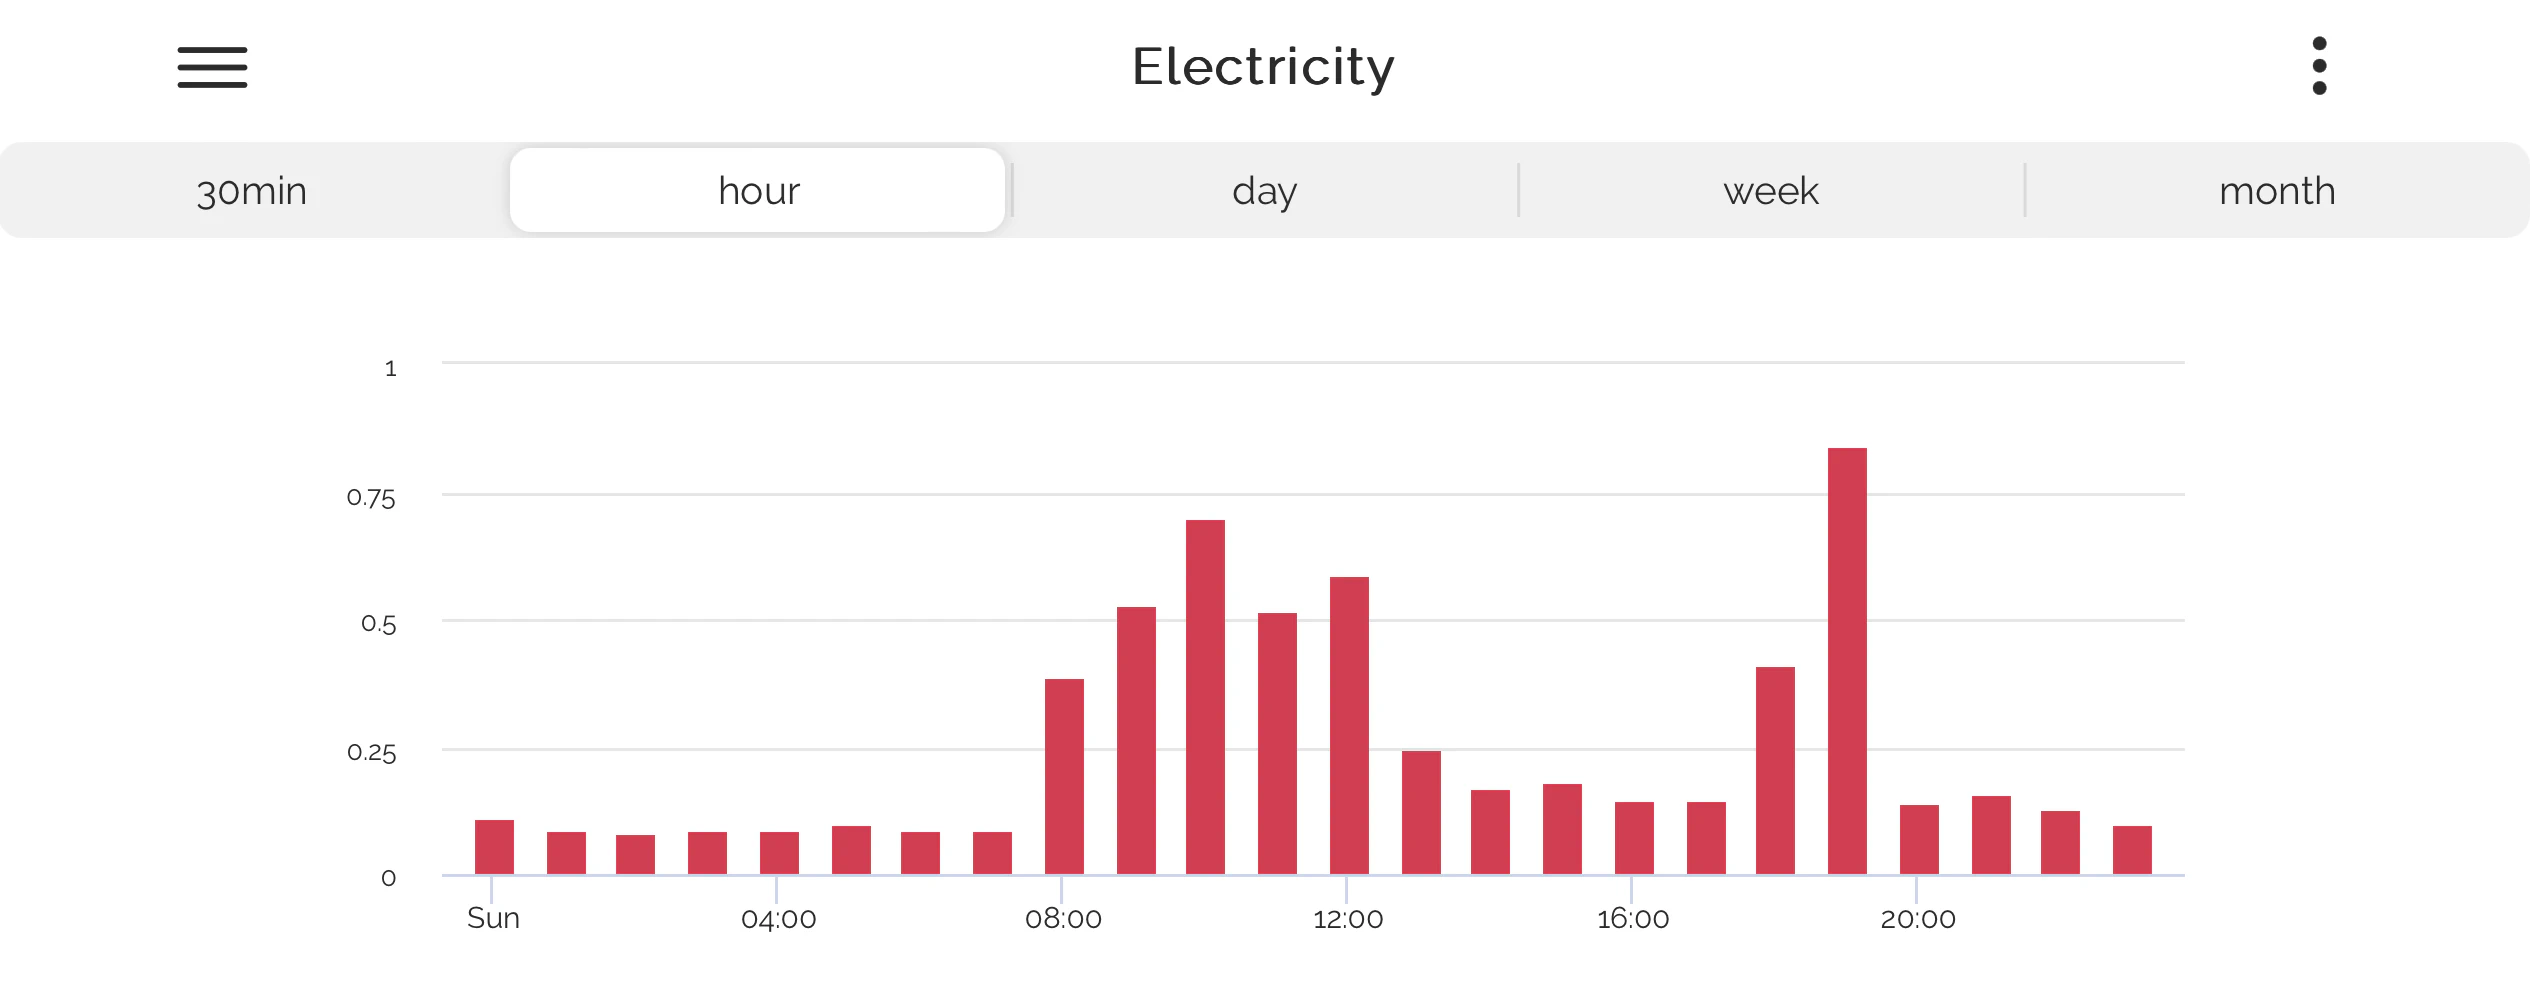
From the web api:
 It looks similar but not exactly so.
When you plot the 3 sources of data (reporting on the same consumption) you get following:
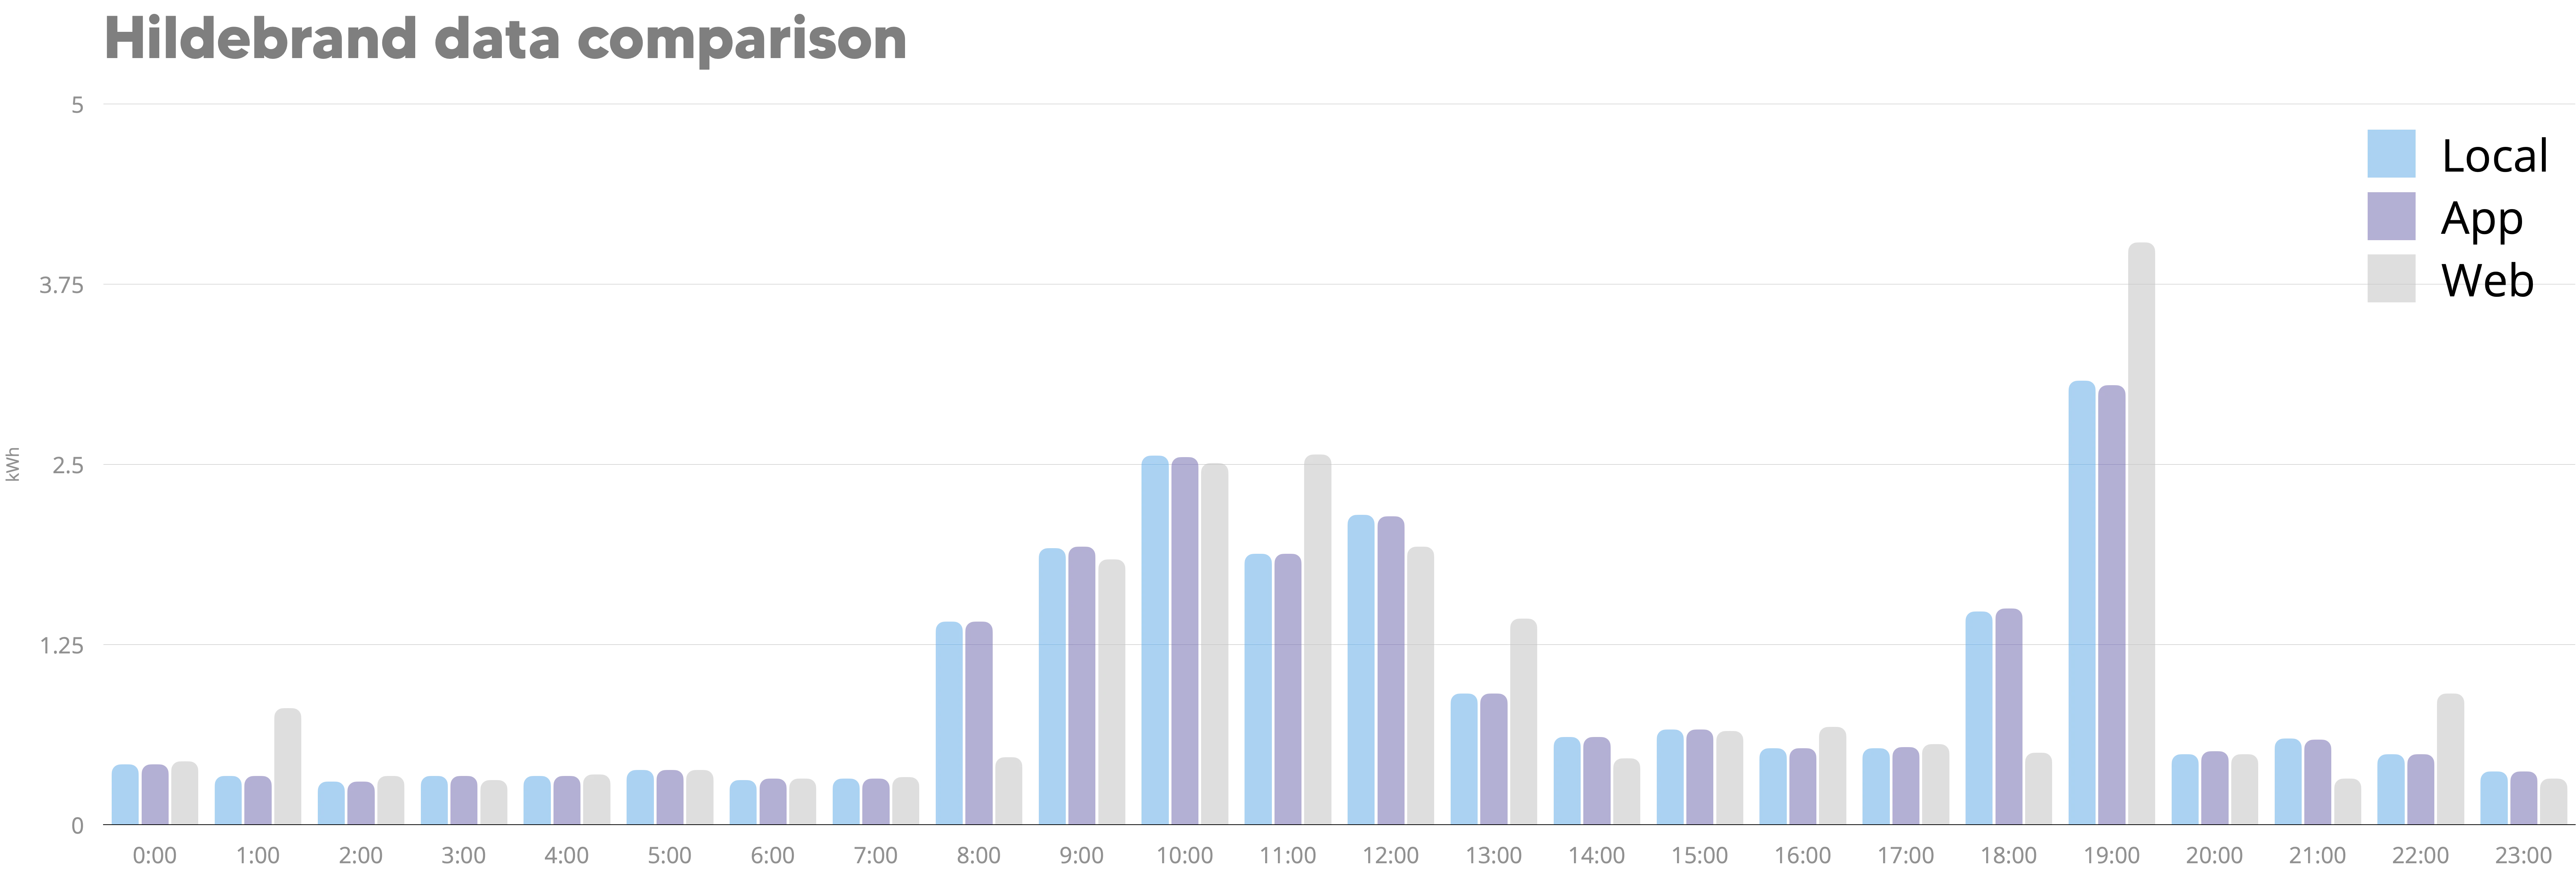
When looked at hourly the web source shows some “catching up” throughout the day overall it is close enough to the daily consumption (2.4%) that we can confidently use it for our purposes.
| Source | kWh | Cost | Difference |
|---|---|---|---|
| CAD | 22.42 | 6.17 | 0 |
| App | 22.43 | 6.17 | 0 |
| Web | 22.96 | 6.32 | 2.4% |
Although good enough, if you are looking to get exact real-time useage then a seperate CAD device in your home will give you the most accurate picture of exactly how much energy you are using now. For maximum utility you want to capture this info as a “stream” so that you can compare it with other times of day or days of week or even look at the impact of seasonailty. There are plenty of online articles about using Hildebrand’s CAD with MQTT and home assistant to achieve this.